Objective
Vanguard S&P Mid-Cap 400 Growth Index Fund seeks to track the performance of a benchmark index that measures the investment return of mid-capitalization growth stocks.
Investment approach
- Seeks to track the performance of the S&P MidCap 400 Growth Index.
- Mid-cap growth equity.
- Passively managed, full-replication approach.
- Fund remains fully invested.
- Low expenses minimize net tracking error.
Performance snapshot
Quarter-end total returnsas of06/30/2025
Note: Returns are unadjusted for transaction fees where applicable.
Note: Except the most recent quarter, the expense ratios presented are the funds' actual operating expenses and they exclude any acquired fees and expenses, which result from the funds' holding in business development companies (BDCs). BDCs expenses are not direct costs paid by fund shareholders and are not used to calculate the funds' net asset value.
The performance data shown represent past performance, which is not a guarantee of future results. Investment returns and principal value will fluctuate, so investors' shares, when sold, may be worth more or less than their original cost. Current performance may be lower or higher than the performance data cited.
Share classesas of
At a glance
Objective
Vanguard S&P Mid-Cap 400 Growth Index Fund seeks to track the performance of a benchmark index that measures the investment return of mid-capitalization growth stocks.
Investment approach
- Seeks to track the performance of the S&P MidCap 400 Growth Index.
- Mid-cap growth equity.
- Passively managed, full-replication approach.
- Fund remains fully invested.
- Low expenses minimize net tracking error.
Process & Management
Process
Vanguard S&P Mid-Cap 400 Growth Index Fund seeks to track the investment performance of the S&P MidCap 400 Growth Index, an unmanaged benchmark representing medium-size U.S. growth companies. Using full replication, the portfolio holds all stocks in the same capitalization weighting as the index. The experience and stability of Vanguard’s Equity Index Group have permitted continuous refinement of techniques for reducing tracking error. The group uses proprietary software to implement trading decisions that accommodate cash flow and maintain close correlation with index characteristics. Vanguard’s refined indexing process, combined with low management fees and efficient trading, has provided tight tracking, net of expenses.
Management
Firm Description
Launched in 1975, The Vanguard Group, Malvern, Pennsylvania, is among the world’s largest equity and fixed income managers. As chief investment officer, Gregory Davis, CFA, oversees Vanguard’s Equity Index, Investment Strategy, Quantitative Equity, and Fixed Income Groups. Rodney Comegys, Principal and global head of Vanguard's Equity Index Group, is responsible for all equity index funds. The Equity Index Group manages indexed equity portfolios covering U.S. and international markets. It has developed sophisticated portfolio construction methodologies and efficient trading strategies that seek to deliver returns that are highly correlated with target portfolio benchmarks. The group has advised Vanguard S&P Mid-Cap 400 Growth Index Fund since 2010.
Investment Manager Biography
Kenny Narzikul, CFA
- Portfolio manager.
- Advised the fund since 2023.
- Worked in investment management since 2016.
- B.B.A., James Madison University.
Chris Nieves, CFA
- Portfolio manager.
- Advised the fund since 2025.
- Worked in investment management since 2013.
- B.A., Cornell University.
- MEng., Cornell University.
| Quarter-end | Year-to-date | 1 year | 3 year | 5 year | 10 year | Since inception[2] | ||
|---|---|---|---|---|---|---|---|---|
 | VMFGX(NAV) | 9.64% | 0.46% | 4.24% | 13.84% | 11.23% | 9.15% | 10.13% |
 | Benchmark[1] | 9.64% | 0.48% | 4.30% | 13.90% | 11.30% | 9.22% | 10.20% |
| +/- Benchmark[4] | 0.00% | -0.02% | -0.06% | -0.06% | -0.07% | -0.07% | -0.07% | |
| Average expense ratio | 0.01% | — | 0.08% | 0.08% | 0.08% | 0.08% | — | |
| Residual error | 0.00% | — | 0.03% | 0.02% | 0.01% | 0.01% | — |
Note: Returns are unadjusted for transaction fees where applicable.
Note: Except the most recent quarter, the expense ratios presented are the funds' actual operating expenses and they exclude any acquired fees and expenses, which result from the funds' holding in business development companies (BDCs). BDCs expenses are not direct costs paid by fund shareholders and are not used to calculate the funds' net asset value.
Quarterly & Annual returns
Expense ratio0.03%
Cumulative returnsas of06/30/2025
Expense ratio0.03%
| 1 month | 3 month | 1 year | 3 year | 5 year | 10 year | Since inception[2] | |
|---|---|---|---|---|---|---|---|
| VMFGX(NAV) | 3.41% | 9.64% | 4.24% | 47.53% | 70.28% | 140.09% | 295.72% |
| Benchmark | 3.42% | 9.64% | 4.30% | 47.75% | 70.81% | 141.64% | 299.21% |
Quarterly commentary
- Despite volatility prompted by trade policy announcements and heightened geopolitical tensions, global equity markets made solid gains for the three months ended June 30, 2025. In the U.S., corporate earnings were robust and inflation readings—although above the Federal Reserve’s target of 2%—showed little impact from higher tariffs. Policymakers left the target for short-term interest rates steady at a range of 4.25%–4.50%.
Risk and volatilityas of06/30/2025
Relative risk measures |
| 3 year | 5 year | 10 year | ||
|---|---|---|---|---|
| Alpha[3] | ||||
| Primary benchmark*[1] | 0.00% | -0.01% | -0.01% | |
| Broad-based benchmark[2][2] | -0.49% | -0.38% | -0.32% | |
| Beta[4] | ||||
| Primary benchmark*[1] | 1.00 | 1.00 | 1.00 | |
| Broad-based benchmark[2] | 1.13 | 1.06 | 1.08 | |
| R-squared[5] | ||||
| Primary benchmark*[1] | 1.00 | 1.00 | 1.00 | |
| Broad-based benchmark[1] | 0.87 | 0.86 | 0.90 | |
| Information ratio[6] | ||||
| Primary benchmark*[1] | -3.24 | -2.93 | -3.35 | |
| Broad-based benchmark[1] | -0.71 | -0.65 | -0.64 | |
Risk and return statistics |
| 3 year | 5 year | 10 year | ||
|---|---|---|---|---|
| Standard deviation | ||||
| VMFGX | 19.79% | 19.17% | 18.19% | |
| Primary benchmark* | 19.79% | 19.17% | 18.19% | |
| Broad-based benchmark | 16.32% | 16.76% | 16.04% | |
| Sharpe ratio | ||||
| VMFGX | 0.46 | 0.44 | 0.39 | |
| Primary benchmark* | 0.46 | 0.44 | 0.40 | |
| Broad-based benchmark | 0.88 | 0.78 | 0.68 | |
| Sortino ratio | ||||
| VMFGX | 0.88 | 0.81 | 0.69 | |
| Primary benchmark* | 0.88 | 0.81 | 0.70 | |
| Broad-based benchmark | 1.47 | 1.31 | 1.10 | |
Risk measures are calculated from trailing 3, 5, and 10 year fund returns relative to the associated benchmarks.
An investment in the fund could lose money over short or even long periods. You should expect the fund’s share price and total return to fluctuate within a wide range, like the fluctuations of the overall stock market. The fund’s performance could be hurt by:
- Stock market risk: The chance that stock prices overall will decline. Stock markets tend to move in cycles, with periods of rising stock prices and periods of falling stock prices. The fund’s target index may, at times, become focused in stocks of a particular sector, category, or group of companies. Because the fund seeks to track its target index, the fund may underperform the overall stock market.
- Investment style risk: The chance that returns from mid-capitalization growth stocks will trail returns from the overall stock market. Historically, mid-cap stocks have been more volatile in price than the large-cap stocks that dominate the overall market, and they often perform quite differently. Mid-cap stocks tend to have greater volatility than large-cap stocks because, among other things, medium-size companies are more sensitive to changing economic conditions.
- Index replicating risk, which is the chance that the fund may be prevented from holding one or more securities in the same proportion as in its target index.
- Index-related risks: The fund is subject to risks associated with index investing, which include passive management risk, tracking error risk, and index provider risk. Passive management risk is the chance that the fund's use of an indexing strategy will negatively impact the fund's performance. Because the fund seeks to track the performance of its target index regardless of how that index is performing, the fund's performance may be lower than it would be if the fund were actively managed. Tracking error risk is the chance that the fund's performance will deviate from the performance of its target index. Tracking error risk may be heightened during times of increased market volatility or under other unusual market conditions. Index provider risk is the chance that the fund will be negatively impacted by changes or errors made by the index provider. Any gains, losses, or costs associated with or resulting from an error made by the index provider will generally be borne by the fund and, as a result, the fund's shareholders.
Closing priceas of07/18/2025
Price analysis
Price history
Inception date: 03/28/2011
Get up to 24 months of prices for this fund. You can also export all prices of this fund since the inception date.
The performance data shown represents past performance, which is not a guarantee of future results. Investment returns and principal value will fluctuate, so that investors' shares, when sold, may be worth more or less than their original cost. Current performance may be lower or higher than the performance data cited.
Performance data for periods of less than one year does not reflect the deduction of purchase and redemption fees. Maintenance, low balance, and service fees may be assessed by some funds. None of these fees are reflected in the performance figures. If these fees were included, the performance would be lower. All other performance data are adjusted for purchase and redemption fees, where applicable. See Fees & Costs below for expense ratio and additional fee details.
The performance of an index is not an exact representation of any particular investment, as you cannot invest directly in an index. Benchmark comparative indexes represent unmanaged or average returns on various financial assets, which can be compared with funds' total returns for the purpose of measuring relative performance.
Source: FactSet financial data and analytics.
Shareholder feesFees paid directly from your investment | |
| Sales charge (load) imposed on purchases | None |
| Purchase fee | None |
| Redemption fee | None |
Annual fund operating expensesExpenses that you pay each year as a percentage of the value of your investment. | |
| Expense ratio | 0.03% |
| 12b-1 distribution fee | None |
Characteristicsas of06/30/2025
| VMFGX | Benchmark | +/- Weight | |
|---|---|---|---|
| Number of stocks | 243 | 243 | 0 |
| Avg market cap | $11.4 billion | $11.4 billion | $0.0 billion |
| Median market cap | $11.1 billion | $11.1 billion | $0.0 billion |
| VMFGX | Benchmark | |
| Earnings growth rate | 22.5% | 22.6% |
| Short-term reserves | — | N/A |
| P/E ratio | 23.8x | 23.7x |
| P/B ratio | 3.9x | 3.9x |
| Turnover rate (Fiscal year-end 08/31/2024) | 48.0% | N/A |
| Return on equity | 15.6% | 15.6% |
| Foreign holdings | 1.29% | N/A |
Market capitalization
| VMFGX | Benchmark[1] | +/- Weight | |
|---|---|---|---|
| Large | 0.5% | 0.5% | 0.0% |
| Medium/Large | 2.8% | 2.9% | -0.1% |
| Medium | 3.2% | 3.1% | 0.1% |
| Medium/Small | 52.3% | 52.2% | 0.1% |
| Small | 44.5% | 44.6% | -0.1% |
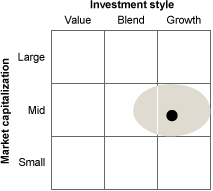
Style box
STOCKS
Index portfolio of mid-capitalization growth stocks.
 Central Tendency
 Expected range
Realized/Unrealized gains as of06/30/2025
Distributions
View up to 10 years of distributions for this fund.
Distribution schedule:Annually | Fiscal year-end date:08/31/2025

The performance data shown represents past performance, which is not a guarantee of future results. Investment returns and principal value will fluctuate, so that investors' shares, when sold, may be worth more or less than their original cost. Current performance may be lower or higher than the performance data cited. See performance data current to the most recent month end.