A lot has changed since Vanguard published its economic and market outlook for 2022, Striking a Better Balance. At the start of the year, we expected global economies to continue to recover from the effects of the COVID-19 pandemic but at a more modest pace than in 2021. While that holds true, the pace of change in macroeconomic fundamentals such as inflation, growth, and monetary policy has failed to live up to expectations.
Labor and supply-chain constraints were already fueling inflation before the year began, but Russia’s invasion of Ukraine and China’s zero-COVID policy exacerbated the situation. Central banks have been forced to play catch-up in the fight against inflation, ratcheting up interest rates more rapidly and possibly higher than previously expected. But those actions risk cooling economies to the point that they enter recession.
“Global economic growth will likely stay positive this year, but some economies are flirting with recession, if not this year, then in 2023,” said Andrew Patterson, Vanguard senior international economist.
Compared with the start of the year, Vanguard has downgraded its 2022 GDP growth forecasts for all the major regions, increased its inflation forecasts, and become more hawkish about monetary policy.
Inflation, policy elevate the risk of recession
In the United States, inflation has reached 40-year highs, eroding consumers’ purchasing power and driving the Federal Reserve to aggressively raise interest rates. We expect the equivalent of 12 to 14 rate hikes of 25 basis points for the full year, with the target federal funds rates landing in the 3.25%–3.75% range by year-end. We expect a terminal rate of at least 4% in 2023—higher than what we consider to be the neutral rate (2.5%) and above what’s currently being priced into the market. (The neutral rate is the theoretical rate at which monetary policy neither stimulates nor restricts an economy.)
We have downgraded expected U.S. GDP growth from about 3.5% at the start of the year to about 1.5%. The factors that led to our downgrade will likely continue through 2022—namely, tightening financial conditions, wages not keeping up with inflation, and lack of demand for U.S. exports. Labor market trends are likely to keep downward pressure on the unemployment rate through year-end, though increases in 2023 are likely as the impacts of Fed policy and slowing demand take hold. We assess the probability of recession at about 25% over the next 12 months and 65% over 24 months. We believe that a period of high inflation and stagnating growth is more likely than an economic “soft landing” of growth and unemployment rates around or above longer-term equilibrium levels (about 2% for growth and 4% for unemployment).
Probability of recession for select regions
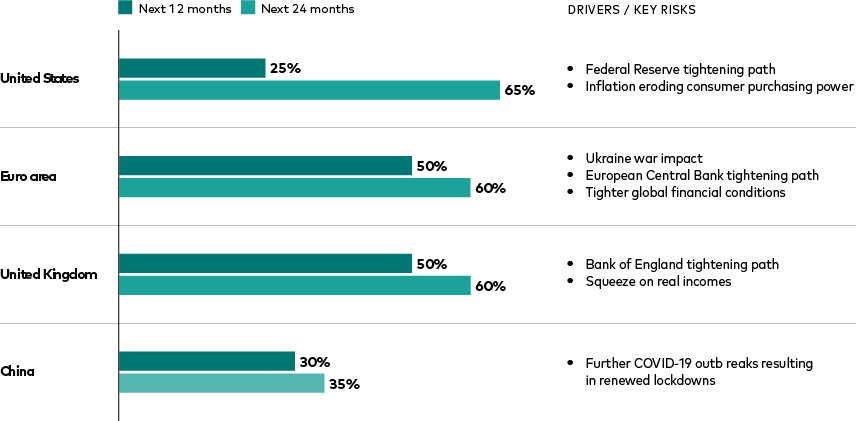
Source: Vanguard forecasts as of July 7, 2022.
Vanguard’s forecasts for year-end 2022

Notes: Forecasts evolve with new data, and our views will inevitably change. Growth is the change in annualized GDP year over year. Inflation is the headline consumer price index, which includes the volatile food and energy sectors. Monetary policy is our year-end projection for the central bank’s short-term interest rate target.
Source: Vanguard forecasts as of July 7, 2022.
Expected 10-year asset class returns have risen
Stock and bond markets have been hit hard so far in 2022. But there is an upside to down markets: Because of lower current equity valuations and higher interest rates, our model suggests higher expected long-term returns.
Our 10-year annualized return forecasts for equity markets are largely 1 percentage point higher than at the end of 2021. In many regions, our bond return forecasts are 1.5 percentage points higher. Rising yields may detract from bonds’ current prices, but that means higher returns in the future as interest payments are reinvested in higher-interest bonds.
Our forecasts are derived from a May 31, 2022, running of the Vanguard Capital Markets Model®. The figures are based on a 1-point range around the 50th percentile of the distribution of return outcomes for equities and a 0.5-point range around the 50th percentile for bonds.
Here are our current 10-year annualized return forecasts. Forecasts are from the perspectives of local investors in local currencies:
U.S. stocks: 3.4% to 5.4%; ex-U.S. stocks: 6.1% to 8.1%.
U.S. bonds: 3% to 4%; ex-U.S. bonds: 2.9% to 3.9% when hedged in U.S. dollars.
IMPORTANT: The projections and other information generated by the VCMM regarding the likelihood of various investment outcomes are hypothetical in nature, do not reflect actual investment results, and are not guarantees of future results. Distribution of return outcomes from VCMM are derived from 10,000 simulations for each modeled asset class. Simulations as of May 31, 2022. Results from the model may vary with each use and over time. For more information, please see the Important information section.
Notes:
- All investing is subject to risk, including the possible loss of the money you invest. Diversification does not ensure a profit or protect against a loss in a declining market. Be aware that fluctuations in the financial markets and other factors may cause declines in the value of your account. There is no guarantee that any particular asset allocation or mix of funds will meet your investment objectives or provide you with a given level of income.
- Investments in stocks and bonds issued by non-U.S. companies are subject to risks including country/regional risk and currency risk. These risks are especially high in emerging markets.
- Bond funds are subject to the risk that an issuer will fail to make payments on time, and that bond prices will decline because of rising interest rates or negative perceptions of an issuer’s ability to make payments.
About the Vanguard Capital Markets Model:
IMPORTANT: The projections and other information generated by the Vanguard Capital Markets Model regarding the likelihood of various investment outcomes are hypothetical in nature, do not reflect actual investment results, and are not guarantees of future results. VCMM results will vary with each use and over time.
The VCMM projections are based on a statistical analysis of historical data. Future returns may behave differently from the historical patterns captured in the VCMM. More important, the VCMM may be underestimating extreme negative scenarios unobserved in the historical period on which the model estimation is based.
The Vanguard Capital Markets Model® is a proprietary financial simulation tool developed and maintained by Vanguard’s Investment Strategy Group. The model forecasts distributions of future returns for a wide array of broad asset classes. Those asset classes include U.S. and international equity markets, several maturities of the U.S. Treasury and corporate fixed income markets, international fixed income markets, U.S. money markets, commodities, and certain alternative investment strategies. The theoretical and empirical foundation for the Vanguard Capital Markets Model is that the returns of various asset classes reflect the compensation investors require for bearing different types of systematic risk (beta). At the core of the model are estimates of the dynamic statistical relationship between risk factors and asset returns, obtained from statistical analysis based on available monthly financial and economic data. Using a system of estimated equations, the model then applies a Monte Carlo simulation method to project the estimated interrelationships among risk factors and asset classes as well as uncertainty and randomness over time. The model generates a large set of simulated outcomes for each asset class over several time horizons. Forecasts are obtained by computing measures of central tendency in these simulations. Results produced by the tool will vary with each use and over time.
Indexes used in Vanguard Capital Markets Model simulations
The long-term returns of our hypothetical portfolios are based on data for the appropriate market indexes through May 31, 2022. We chose these benchmarks to provide the most complete history possible, and we apportioned the global allocations to align with Vanguard’s guidance in constructing diversified portfolios. Asset classes and their representative forecast indexes are as follows:
U.S. equities: MSCI US Broad Market Index.
Global ex-U.S. equities: MSCI All Country World ex USA Index.
U.S. aggregate bonds: Bloomberg U.S. Aggregate Bond Index.
Global ex-U.S. bonds: Bloomberg Global Aggregate ex-USD Index.