- The U.S. population is aging.
- The bond market continues to grow and mature.
- An increasing number of plan sponsors want to keep retirees in the plan.

Considered together, these trends can help inform a smarter fund-lineup strategy for plan sponsors looking to foster a longer-lasting partnership with their participants.
Broad-based fixed income investments are, of course, a key component of target-date funds (TDFs). In fact, 98% of plan sponsors offered TDFs as the qualified default option for participants in 2023, cementing TDFs (and thus fixed income) as a staple in the first tier.1 We also know that a majority of sponsors offer fixed income options in the supplemental (third) tier.2 ,3 However, plan sponsors may want to consider reviewing their options to ensure they are meeting the unique needs of their participants, as plan sponsors may be leaving untapped a retention strategy that can also help deliver stronger results for participants looking for that type of investing flexibility.
For plan sponsors, putting the strategy into practice is straightforward: Select from among a broad array of options through a supplemental tier to meet your participants’ needs and objectives. These options can include retirement income solutions or professionally managed accounts, which generally use the core, or tier two, options offered in the plan, in addition to a well-aligned supplemental selection. According to the 2024 edition of How America Saves—our annual report on the retirement saving behaviors of nearly 5 million Vanguard DC plan participants—99% of plans offered a fixed income option and 80% offered active fixed income in 2023.4 This is despite the fact that 83% of all participants used TDFs and 70% of them had their entire account invested in a single TDF.5
So, why offer different or additional fixed income options in tier three, the supplemental tier, at all?
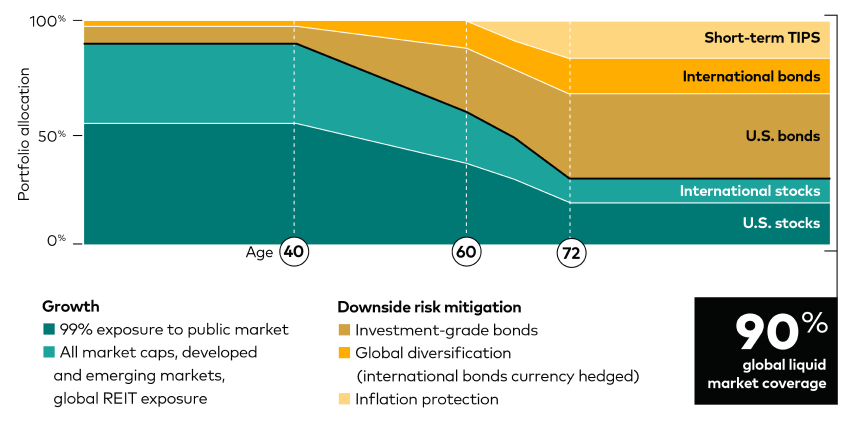
The construction of our TDFs is based on the average investor: someone with a conservative risk tolerance who saves at the average rate for their age cohort, wants to retire at age 65, and expects 75% to 80% of their ending salary annually in retirement.6 Figure 1 shows Vanguard’s target-date glide path and asset allocation through a participant’s life cycle.
But not all participants are average investors.
TDFs may not address some participants’ unique circumstances, nontypical risk tolerances, or appetite to have more control or more customized advice. For those investors, supplemental options in a plan lineup become even more critical as retention tools.
Aging demographics
Considering the changing makeup of the population, what may have been appropriate in the past may not meet the needs of participants in the future. The median age of the labor force was 40.3 years in 2003, 41.6 years in 2023, and is projected to be 42.4 years by 2033, according to August 2024 data by the U.S. Bureau of Labor Statistics. Participants are also working longer than in years past. Proof of this can be found through changes to the required minimum distribution (RMD) rules in SECURE Act and SECURE 2.0 Act. Individuals born in 1960 or later are not required to take an RMD from pre-tax retirement accounts until age 75; up from age 72, which had changed from 70.5 in 2019.
Underlying these changes is the increasing share of both the overall and working populations in the U.S. that is made up of older adults. According to the Population Reference Bureau, 17% of the U.S. population was 65 or older in 2022. That number is expected to increase to 23% by 2050.
Changes to the global fixed income market
Historically, in addition to a capital preservation vehicle like stable value or money market, plan sponsors are attracted to a broad-based U.S. fixed income option. While this remains a good starting point for plan sponsors, the global fixed income market has grown and matured over the last two decades or so.
Since the turn of the century, the size of the U.S. aggregate bond market increased fivefold to almost $31 trillion.8 During the same time, the U.S. high-yield corporate market, which is not a part of the U.S. aggregate bond market, experienced increased credit quality and expanded more than three times its size, to approximately $1.4 trillion.9 Figure 2 shows the credit quality shift of the U.S. high-yield corporate market today compared with the end of 1999.
| Credit quality segment | December 31, 1999 | December 31, 2024 | Change in percentage points10 | Change in percentage11 |
|---|---|---|---|---|
| BB | 34% | 51% | 17 | 50% |
| B | 56% | 35% | -21 | -37% |
| CCC | 6% | 12% | 6 | 88% |
| Below CCC | 4% | 2% | -2 | -50% |
The shift in size and credit quality is also apparent in the emerging markets (EM) debt market. This market has expanded almost sevenfold, and the credit quality spectrum is meaningfully different. At the end of 1999, 90% of EM debt was rated below investment-grade. Today, that number is only about 39%, making most of the aggregate EM debt investment-grade quality.12
These dynamics, along with higher bond market liquidity, lower trading costs, and advanced trading technology, have broadened the fixed income investable universe, giving participants more cost-effective passive and active options to tailor their needs. Over the last decade, we’ve taken advantage of that broadening universe to grow our fixed income capabilities and expand our product suite. We launched Vanguard Emerging Markets Bond, Emerging Markets Government Bond Index, and Global Credit Bond Funds along with Vanguard Ultra-Short, Core, Core Plus, and Multi-Sector Income Funds. These actively managed products can provide investors with greater options and flexibility. Vanguard’s approach to active management is built on exceptional talent, proven discipline, unparalleled client alignment, and low cost—factors that investors should consider when selecting any active manager. In fact, 100% of Vanguard active fixed income funds are now in the lowest-cost decile of their Morningstar category.13 Our low cost means that we can afford to be more judicious in taking on risk, and it gives us an asymmetric advantage when seeking to deliver net outperformance.
Retaining plan assets helps improve participant outcomes
One of Vanguard’s four pillars of investment success is cost. Most plan sponsors are aware of the benefits that scale and balance aggregation provide to participants in the form of lower costs for share classes not otherwise possible outside the plan. All else being equal, the lower the mutual fund expense ratio, the more return retained by the investor. Figure 3 shows that even a relatively small difference in expense ratio can create a meaningful difference for participant account balances over time.
Let’s assume that after 10 years, a participant has accumulated $100,000 in their retirement account and plans to work for another 30 years. If one compares a 0.10% expense ratio fund with a 0.30% expense ratio fund, the savings after 30 years amounts to close to $25,000. If the same 0.10% expense ratio fund is compared with a fund that charges 0.50%, that difference increases to just more than $35,000.14
| No expenses (Base) | 0.10% expense ratio | 0.30% expense ratio | 0.50% expense ratio | |
|---|---|---|---|---|
| Initial investment | $100,000 | $100,000 | $100,000 | $100,000 |
| Time until retirement (years) | 30 | 30 | 30 | 30 |
| Expected return | 4.00% | 4.00% | 4.00% | 4.00% |
| Periodic investment | $4,000 | $4,000 | $4,000 | $4,000 |
| Future value of investment | $548,680 | $535,742 | $510,836 | $487,170 |
| Cumulative fees | $12,938 | $37,843 | $48,572 |
Vanguard has the tools and tenure to help
Vanguard believes in both active and passive investing, and we’ve managed fixed income assets for our investors since 1982. Vanguard has $2.5 trillion in fixed income and $1.1 trillion in active fixed income.15 As a result, our scale and expertise is nearly unmatched. Our exceptional talent, disciplined approach, and unique alignment to clients has helped 91% of Vanguard’s active bond funds beat their 10-year Lipper peer-group averages.16 Along with our client alignment, our beneficial scale and sophisticated process sets fixed income indexing apart from others.
Our wide range of solutions goes beyond our fund lineup. These solutions also include participant advice, a key pillar of financial well-being, in an environment where only 34% of U.S. nonretirees think their retirement saving is on track.17 Vanguard integrates personalized financial wellness experiences, trusted advice services, and built-to-last investments to help employees manage their short-term financial needs while continuing to ensure they are on track for retirement success.
Catch more Vanguard Viewpoints.
1 How America Saves 2024. Vanguard, 2024.
2 A basic framework or a tiered plan lineup includes: tier one, a single-fund solution; tier two, building blocks which generally consist of broadly diversified options and/or the individual mutual funds in a plan’s single-fund solution; tier three, supplement choices. Supplement choices are additional strategies, though not essential for creating fully diversified portfolios, that offer more specialized access to investment styles, asset classes, or individual securities.
3 How America Saves 2024. Vanguard, 2024.
4 How America Saves 2024. Vanguard, 2024.
5 How America Saves 2024. Vanguard, 2024.
6 Aliaga-Díaz, Roger, and Nathan Zahm. Selecting an Optimal Glide Path for Target Retirement Funds. Vanguard, 2022.
7 Cerulli Associates. The Cerulli Edge: U.S. Retirement Edition. 2023.
8 Barclays Live. Bloomberg US Aggregate Bond Index data comparing December 31, 1999, with December 31, 2024.
9 Barclays Live. Bloomberg US High-Yield Index data comparing December 31, 1999, with December 31, 2024.
10 Any number discrepancy is due to rounding.
11 Any number discrepancy is due to rounding.
12 Barclays Live. Bloomberg Emerging Markets USD Aggregate Index data comparing December 31, 1999, with December 31, 2024.
13 Hypothetical illustration using a simple, end-of-period future value calculation. We assume the participant makes $50,000 every year over the time horizon and they contribute 4% of their salary per year with a 100% company match up to 4%. We also assume a 4% annualized return. The expense ratio is deducted from the expected 4% annualized return. For example, the effective return used to calculate the future value of the 0.10% example is 3.90%.
14 All competitor fund data is sourced from Morningstar Direct as of November 2024. The combination of Morningstar category, investment type, and management style define Vanguard’s “category.” Lowest-decile expense ratios are calculated excluding Vanguard funds. Vanguard’s updated expense ratios (effective February 1, 2025) were compared with the lowest-decile expense ratios in each category. Summing all active fixed income funds that were less than or equal to the lowest-decile expense ratio and dividing by total active fixed income funds resulted in 100% of funds in the lowest-cost decile.
15 Assets under management as of December 31, 2024.
16 For the 10-year period ended December 31, 2024, 40 of 44 Vanguard actively managed bond funds outperformed their peer group averages. Results will vary for other time periods. Only funds with a 10-year history, were included in the comparison. (Source: Lipper, a Thomson Reuters Company.) Note that the competitive performance data shown represent past performance, which is not a guarantee of future results, and that all investments are subject to risks. For the most recent performance, visit our website at vanguard.com/performance.
17 Economic Well-Being of U.S. Households in 2023. The Federal Reserve Board, May 2024.
Notes:
- For more information about Vanguard funds, visit vanguard.com to obtain a prospectus or, if available, a summary prospectus. Investment objectives, risks, charges, expenses, and other important information about a fund are contained in the prospectus; read and consider it carefully before investing.
- All investing is subject to risk, including the possible loss of the money you invest.
- Diversification does not ensure a profit or protect against a loss. There is no guarantee that any particular asset allocation or mix of funds will meet your investment objectives or provide you with a given level of income.
- Investments in Target Retirement Funds are subject to the risks of their underlying funds. The year in the Fund name refers to the approximate year (the target date) when an investor in the Fund would retire and leave the workforce. The Fund will gradually shift its emphasis from more aggressive investments to more conservative ones based on its target date. The Income Fund has a fixed investment allocation and is designed for investors who are already retired. An investment in a Target Retirement Fund is not guaranteed at any time, including on or after the target date.
- Vanguard is responsible only for selecting the underlying funds and periodically rebalancing the holdings of target-date investments. The asset allocations Vanguard has selected for the Target Retirement Funds are based on our investment experience and are geared to the average investor. Regularly check the asset mix of the option you choose to ensure it is appropriate for your current situation.
- Bond funds are subject to the risk that an issuer will fail to make payments on time, and that bond prices will decline because of rising interest rates or negative perceptions of an issuer's ability to make payments.
- Investments in bonds are subject to interest rate, credit, and inflation risk.
- Stocks and bonds of companies based in emerging markets are subject to national and regional political and economic risks and to the risk of currency fluctuations. These risks are especially high in emerging markets.
- A stable value investment is neither insured nor guaranteed by the U.S. government. There is no assurance that the investment will be able to maintain a stable net asset value, and it is possible to lose money in such an investment.
- Advice services are provided by Vanguard Advisers, Inc., a registered investment advisor, or by Vanguard National Trust Company, a federally chartered, limited-purpose trust company.